


The Invention of the “High-Cost” State
America Wasn't Always A Place of "Expensive" and "Affordable" States, Nor Does It Need To Be.

In season four of Stranger Things, one of the protagonists—a single mother of three who works as a telemarketer—moves from a fictional midsized Indiana city to a fictional Southern California suburb in 1985. Viewers can’t decide if it’s Anaheim, Redlands, or Ventura, but suffice it to say it’s near Los Angeles. It’s a five-bedroom, four-bathroom ranch house—a big step up from the family’s rundown Midwestern shack.
Upon watching the show, a Los Angeles friend quipped: “The most unrealistic thing in this show about interdimensional demons and psychic powers is the idea that a single mother could afford to move to California.” And it’s true: even in the 1980s, elements of this story seem absurd. The writers felt compelled to throw out that a physicist friend helped her pay for the home.

But this plot detail wasn’t quite so absurd as it might at first seem. Forty years ago, Southern California was still a place where a single parent could show up and improve her prospects. Our protagonist probably wouldn’t be living in a McMansion, but she could secure a decent, affordable apartment—and eventually, a reasonably sized suburban home of her own.
Today, even this scaled-down “California Dream” scenario reads like science fiction.
The truth is that the divergence of “expensive” and “affordable” American states is a recent phenomenon. In 2000, the median home price in Hawaii was approximately three times the median home price in West Virginia—today, it is five times as expensive. It’s an extreme example, but the general principle holds: While housing has become more expensive everywhere, it has become a lot more expensive in certain states.

Of courstate home prices have always varied. But for most of history, this was a function of variation in incomes. In places where incomes were higher, housing prices were also higher. The higher home price you might see in a wealthy state like Massachusetts was a function of higher incomes—a form of national inequality Americans would quickly flatten by moving from poorer states like Mississippi.
Then in the 1970s, something weird started to happen: states started to diverge on this ratio as well.

The chart above looks at states. If we zoom in on cities, the situation is even bleaker. Take Harris County, home of Houston, and Los Angeles County, home of Los Angeles. In 1970, the ratio of median home value to median household income was 1.4 and 2.2, respectively. In 2020, it was 3.0 and 8.6. While Houston remains a place where normal Americans can show up and claim their slice of the dream, Los Angeles excludes all but the most affluent households.

What gives? Every state went through the same 1970s and 2020s inflation, and to varying degrees, the ratio of home prices to incomes has increased everywhere. Yet in a subset of states, this ratio increased dramatically—in many cases, far beyond a healthy upper bound of five. There’s no avoiding the fact that a divergence in state policies is driving this trend.
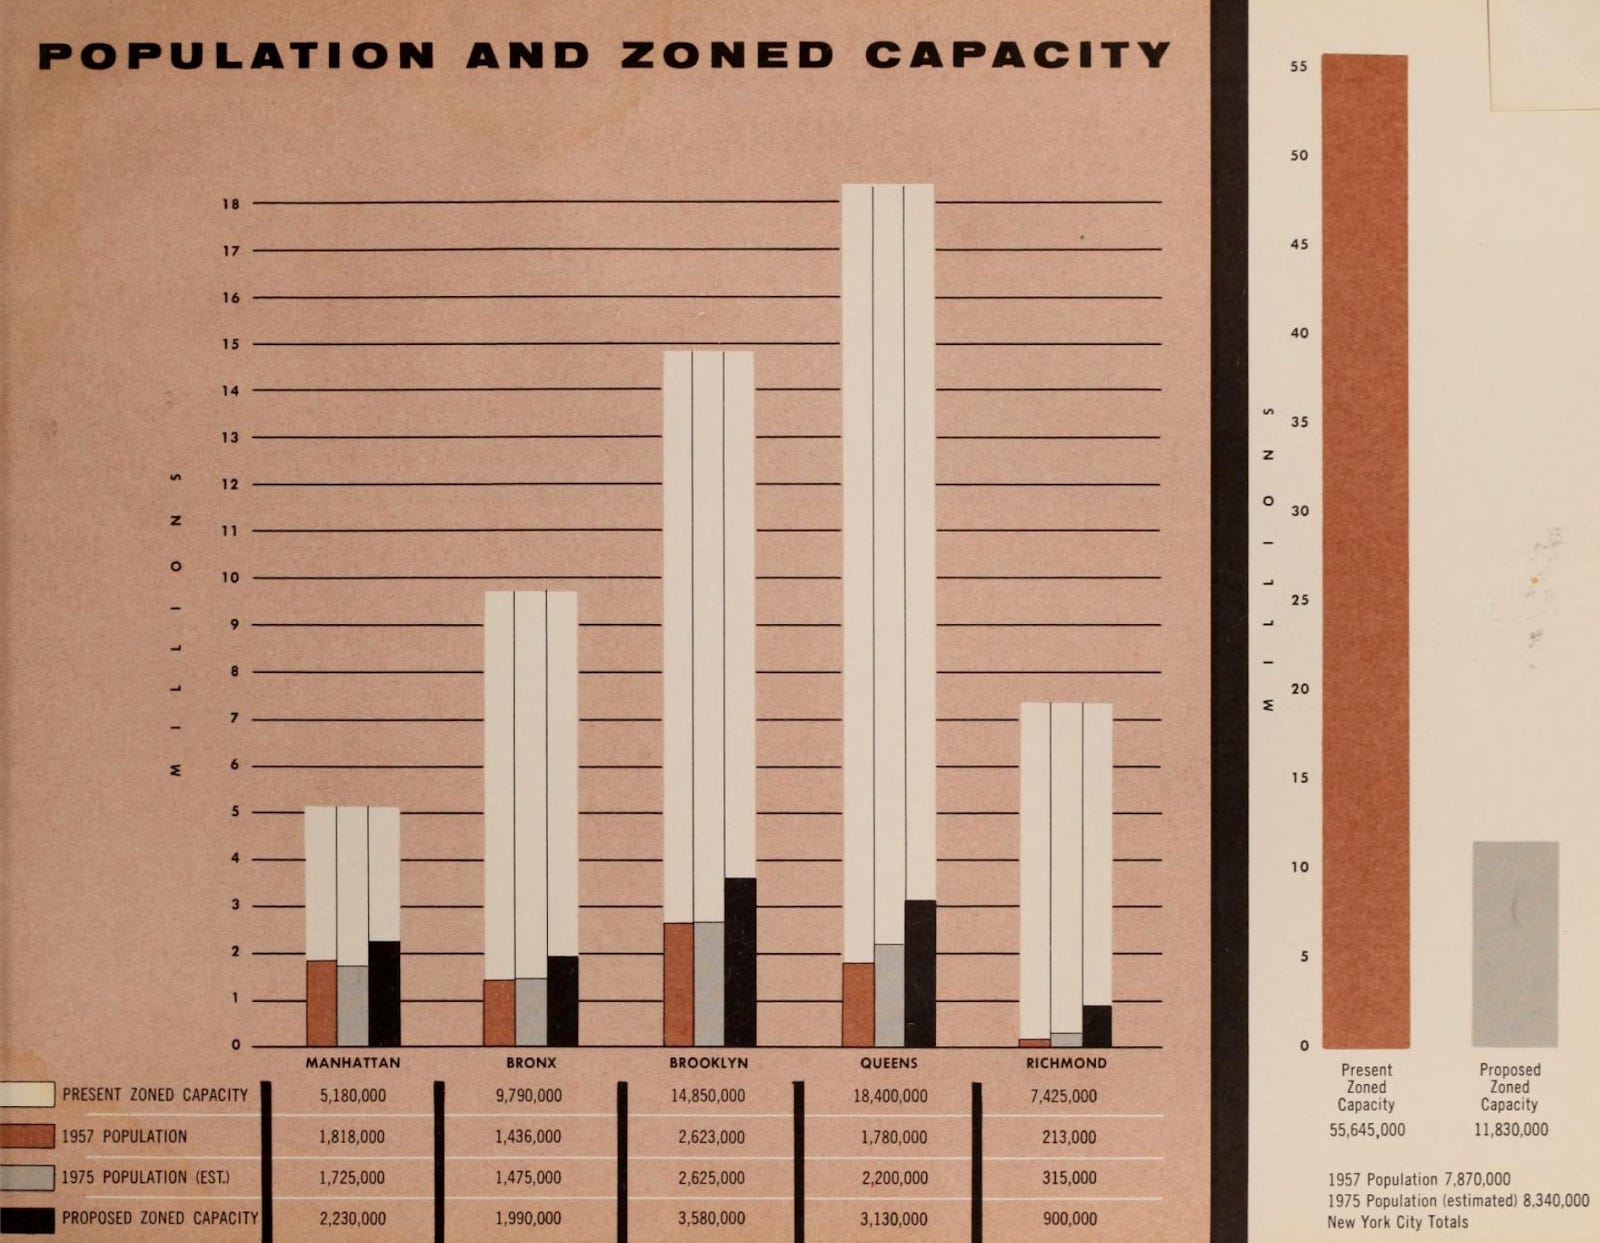
The details of the story vary, but the contours are the same: Over the past 50 years, blue states made it much harder to build housing. In states like Vermont, the “quiet revolution” ushered in a wave of new choke points to building. In states like California, environmental review requirements threw sand into the gears of construction. In states like New York, local downzonings reduced the zoned capacity of the Big Apple from 55 million to around 12 million residents.
How is American history different if all of the most productive blue states hadn’t spent the past 50 years doing everything in their power to thwart growth, and once-poor red states hadn’t done everything in their power to encourage growth? It’s probably impossible to overstate. I suspect America as a whole—blue and red states alike—is a little more purple.

Their persistent failure on this issue has increasingly put Democrats at a permanent disadvantage. In 2020, California lost an electoral college vote—and a member of Congress—for the first time in the state’s history. On net, solid Democratic states collectively lost one electoral college vote; red states on net gained four. At present trends, solid Democratic states are set to lose nine electoral college votes in 2030; solid Republican states are set to gain 10.
The party that builds the future will own the future.
Surprised to say I don't recall ever learning about the 1961 downzoning of NYC. I need to learn more about this.
It’s not just house prices. Taxes in blue states are way up. You’ll notice that most sunbelt states have 1.x% property taxes while most blue states have 2.x% (on higher house assessments). California kept property tax down but makes up for it with income and other taxes.
The truth is that most blue states and cities are run by their unions (especially the teachers union). Their tax base exists to fund those unions, and they squeeze them for all they are worth. NYC spends $36,000 a year per kid in k-12. That’s a racket. And it doesn’t even county the unfunded pensions most of these states have.
That’s why I don’t see the situation improving. These are one party states and the primaries of that one party are owned by the machine politics of the unions.